Did Your Childhood Toys Beat the Stock Market?
Sealed Pokémon packs, LEGO sets, G1 Transformers — some childhood collectibles returned more than the S&P 500. Here is how to check yours.
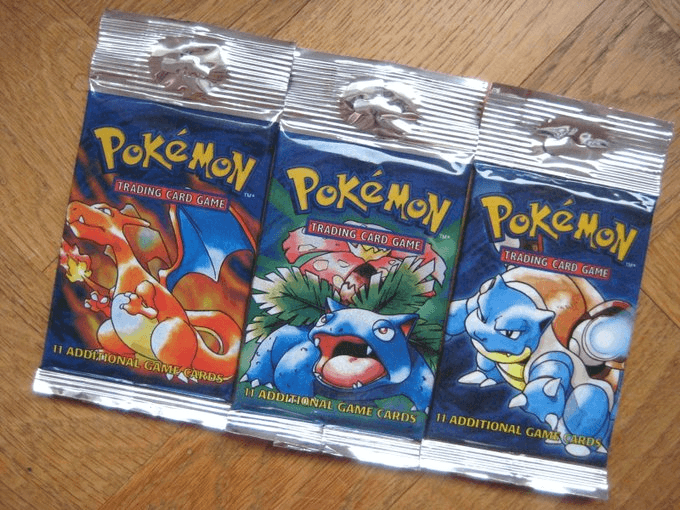
A sealed first-edition Charizard card that cost $4 in 1999 is worth over $400,000 today. A mint G1 Optimus Prime that retailed for $24 in 1984 sold for $16,523 in 2023. The S&P 500 did well over those same periods. Some of these toys did better.
That is the question the Nostalgia Beats Market calculator is built to answer — rigorously, with sources.
What the tool actually does
Pick any item from the catalog — Pokémon cards, LEGO sets, Game Boy, Air Jordans, Tamagotchi, Mickey Mantle baseball cards — and the tool overlays its price history against gold, cash, and the S&P 500 on the same chart.
Every data point is sourced. Every verdict is graded: excellent, good, moderate, mixed, poor, terrible. There is no hand-waving. If a toy underperformed a savings account, the tool says so.
The items span categories: toys, sports cards, video games, sneakers, tech. The time horizons go back to the 1950s for the oldest baseball cards, the mid-1980s for the first wave of action figures, and the late 1990s for Pokémon and early gaming.
The results that actually surprise people
Most collectibles are terrible investments. Furbies, Webkinz, most Pogs — they peaked in cultural memory and collapsed in resale value. That part is not surprising.
What is surprising is how a small subset compounded relentlessly:
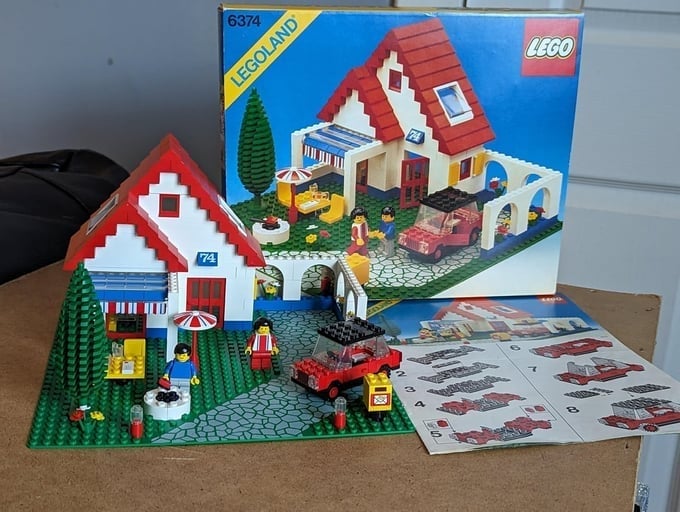
- LEGO sealed sets have averaged ~10–13% annual returns since 2005 — consistently outpacing the S&P 500 in the same period, with lower volatility.
- Pokémon cards had a rocky first decade, then exploded. The 2016–2021 run produced 70–90% annual returns. Even accounting for the post-2021 correction, a 1999 booster box bought for $80 is worth $5,000–$15,000 today.
- Mickey Mantle's 1952 Topps card, bought for a nickel, is now $63,000 in average condition — and $12.6 million in the finest known grade.
- First-generation iPhone (2007, $599) — used models now fetch $35,000–$55,000 sealed. That is a ~6,000% return in 17 years.
Why collectibles can beat traditional assets
Three forces drive it — and they are the same forces that make any alternative asset appreciate over long horizons.
Fixed supply. LEGO retires sets. Pokémon print runs from the 1990s are finite. The market can manufacture new demand (nostalgia waves, media reboots, YouTubers opening vintage packs) but it cannot manufacture new supply.
Condition premium. The difference between a played Charizard and a PSA 10 Gem Mint one is not 10% — it is 1,000%. Grading services like PSA and BGS have created a liquidity layer for the top tier that functions almost like an exchange.
Cultural anchoring. These objects are tied to specific generational memories. As the people who grew up with them enter peak earning years — mid-30s to 50s — demand spikes. This is not random. It is demographic clockwork.
The honest caveat
The tool shows the winners. Survivorship bias is real — the attic full of 1990s toys probably contains 90% items worth nothing and 10% items worth something.
Storage, insurance, grading fees, liquidity risk — none of these show up in the return charts. A sealed LEGO set sitting in a temperature-controlled room for 20 years is not a passive investment. It is a storage problem with a potentially good outcome.
The tool is explicit about this. It is not a broker. It is a clean room for asking "what if?" with real numbers.
Use it as a lens, not a ledger
The most useful thing Nostalgia Beats Market does is not tell you what your childhood toys are worth. It is showing you that return on investment is not confined to stocks and bonds — that asset classes emerge from cultural moments, and that understanding what drives value in any market (supply constraints, demand cycles, condition premiums) is a transferable skill.
The same mental models that explain why a sealed LEGO Cafe Corner appreciates explain why early Bitcoin was underpriced, why certain domain names sold for millions, why first-edition anything tends to compound.
Financial literacy is not about memorizing rules. It is about recognizing patterns. The tool just makes those patterns vivid.
INTERNAL LINK SUGGESTIONS:
- "The hidden fees eating your savings account returns" — same audience (people rethinking conventional finance)
- "What is store-of-value investing and why it matters now" — extends the alternative assets thread